Xdebug is a very popular PHP extension that helps with debugging and profiling of PHP scripts by providing a lot of valuable debug information. Microsoft WebMatrix is a development tool for building web applications. When WebMatrix is used to build or modify a PHP-based web application the debugging tasks can be greatly simplified if Xdebug extension is used. This post explains how to install and use Xdebug extension with WebMatrix.
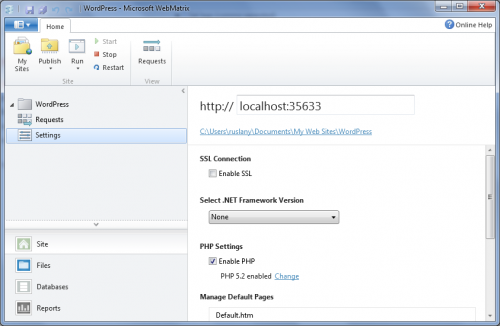
Step 1: Enable PHP in WebMatrix from the site “Settings” page:
Note that if you installed any of the PHP applications from the Application Gallery then PHP will be automatically enabled.
Step 2: Download the appropriate build of Xdebug extension from downloads page. If your site uses PHP 5.2 then download “5.2 VC6 Non-thread safe (32 bit)”. If your site uses PHP 5.3 then download “5.3 VC9 Non-thread safe (32 bit)”. Use 32 bit build even if your Windows OS is 64 bit.
Step 3: Install the extension by copying the downloaded file to the following locations:
- For PHP 5.2 on Windows 64 bit:
C:\Program Files (x86)\IIS Express\PHP\v5.2\ext\ - For PHP 5.2 on Windows 32 bit:
C:\Program Files\IIS Express\PHP\v5.2\ext\ - For PHP 5.3 on Windows 64 bit:
C:\Program Files (x86)\IIS Express\PHP\v5.3\ext\ - For PHP 5.3 on Windows 32 bit:
C:\Program Files\IIS Express\PHP\v5.3\ext\
Step 4: Open the php.ini file located in the PHP installation folder, e.g.
C:\Program Files\IIS Express\PHP\v5.2\php.ini and append the following at the end (make sure that the absolute path is correct for your version of PHP and Windows.):
[xdebug]
zend_extension = C:\Program Files\iis express\PHP\v5.2\ext\php_xdebug-2.1.0-5.2-vc6-nts.dll
Step 5: Configure PHP to display errors by changing these PHP settings in php.ini file:
display_errors = On
error_reporting = E_ALL & ~E_NOTICE
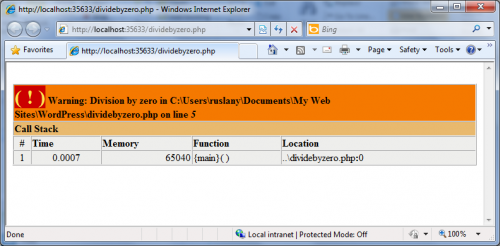
Step 6: Test that extension is enabled and works by either calling a phpinfo() function from a script or by running a buggy script:
The Xdebug extension provides a lot of useful features that help with debugging of PHP applications. You can learn more about them from the Xdebug documentation. For example you can use it to profile a PHP application. Just change the php.ini file as shown below and then make a request to a PHP script:
[xdebug]
zend_extension = C:\Program Files\iis express\PHP\v5.2\ext\php_xdebug-2.1.0-5.2-vc6-nts.dll
xdebug.profiler_enable = On
xdebug.profiler_output_dir = C:\Windows\temp
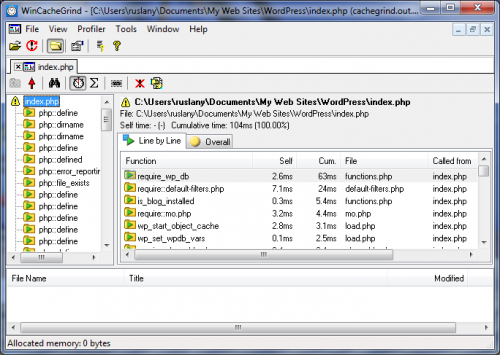
The profile log will be saved into the specified directory and will have a name cachegrind.out.* Use WinCacheGrind to open and analyze it:


Add a Comment